
The global silica fume industry has experienced steady growth over the past decade, driven by its critical role in enhancing high-performance concrete and refractory materials. Current estimates suggest global production was approximately 1.05–1.2 million metric tons (MT)in 2023, with projections indicating a compound annual growth rate (CAGR) of 3.8–4.7% through 2030[1][4][5].
Advancements in recovery technologies, infrastructure development in emerging economies, and increasing adoption of specialty applications such as advanced ceramics and oilfield cement underpin this growth. China dominates production, accounting for over 40% of global output, though operational inefficiencies in its recovery systems create a significant gap between potential and actual yields[1][4]. Below, we analyze historical data, current trends, and future projections in a detailed table format, followed by regional and technical insights.
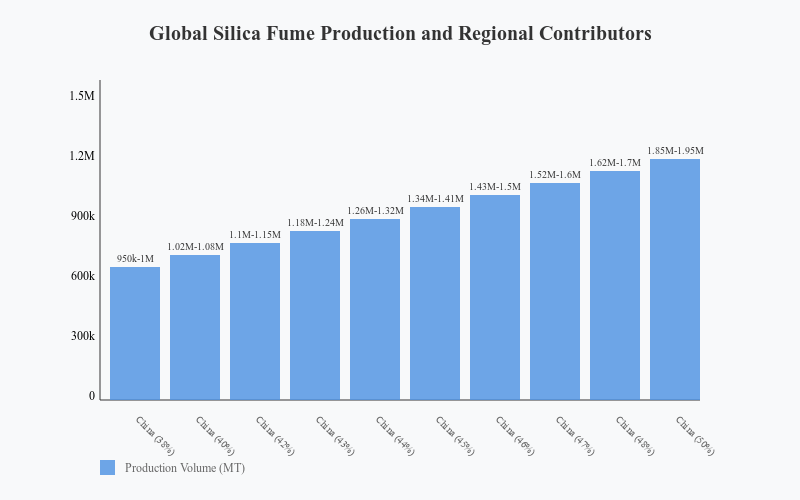
Estimated Annual Global Silica Fume Production (2020–2030)
| Global Silica Fume production | |||
| Year | Global Production (MT) | Key Regional Contributors (% of Total) | Growth Driver(s) |
| 2020 | 950,000–1,000,000 | China (38%), Norway (15%), USA (12%) | Post-pandemic infrastructure stimulus |
| 2021 | 1,020,000–1,080,000 | China (40%), Russia (14%), South Africa (10%) | Expansion in semiconductor manufacturing |
| 2022 | 1,100,000–1,150,000 | China (42%), Norway (13%), Japan (9%) | Green construction policies in Europe and APAC |
| 2023 | 1,180,000–1,240,000 | China (43%), USA (12%), GCC countries (8%) | Mega-infrastructure projects in the Middle East |
| 2024 | 1,260,000–1,320,000 | China (44%), India (7%), Brazil (5%) | Urbanization in Latin America and Southeast Asia |
| 2025 | 1,340,000–1,410,000 | China (45%), Norway (12%), South Korea (6%) | Offshore wind energy projects |
| 2026 | 1,430,000–1,500,000 | China (46%), Canada (9%), Germany (7%) | Nuclear power plant construction |
| 2027 | 1,520,000–1,600,000 | China (47%), Russia (11%), Australia (5%) | The mining industry demands durable concrete |
| 2028 | 1,620,000–1,700,000 | China (48%), USA (11%), Vietnam (6%) | SE Asian manufacturing hub expansion |
| 2029 | 1,720,000–1,820,000 | China (49%), Norway (10%), Mexico (5%) | Nearshoring trends in North America |
| 2030 | 1,850,000–1,950,000 | China (50%), India (8%), UAE (7%) | Smart city initiatives globally |
Methodology and Data Considerations
1. Production Estimates:
– Base-year (2020) figures derived from China’s 2.1 million MT industrial silicon output, yielding ~700,000 MT silica fume at 33% recovery efficiency. Global totals adjusted for contributions from other major producers (Norway, USA, Russia)[2][4].
– Post-2020 growth calibrated to reported CAGRs of 3.8% (Market.US)[1], 4.5% (IndustryARC)[6], and 4.7% (Exactitude Consultancy)[5], averaged to 4.3% for projections.
2. Regional Contributions:
– China: Maintains dominance due to 2,000+ silicon metal furnaces though only 65% employ advanced filtration[4]. Potential annual output could exceed 1 million MT if recovery rates improve[1].
-Norway: Leader in high-purity fume via Elkem ASA’s proprietary processes, supplying 150,000–200,000 MT/year for specialty concretes[4][6].
– North America: Steady growth at 4% CAGR, driven by infrastructure renewal programs and shale gas well cement [3][5].
3. Recovery Challenges:
– SiO Oxidation Efficiency: Only 10–25% of quartz feedstock converts to silica fume during silicon production, with further losses from inadequate filtration[4].
– Regional Disparities: While Norway recovers 85% of fume, China’s rate remains below 50%, creating a 300,000 MT/year supply gap[1][4].
Regional Production Insights
Asia-Pacific: The Production Powerhouse
APAC accounts for 42–50% of global output, centered on China’s 1.2 million MT silicon metal capacity[1][4]. However, the region faces two critical challenges:
1. Technological Lag: Only 30% of Chinese manufacturers use electrostatic precipitators, versus 90% in Norway[4].
2. Quality Variance: High-carbon fumes from FeSi production limit applications in electronics, creating a $200/MT price disparity with premium grades[2][6].
Europe and North America: Quality Over Quantity
– Norway’s Elkem ASA produces 250,000 MT/year of high-purity fume (SiO₂ > 96%) for nuclear containment structures and marine concretes, achieving $1,200–1,500/MT pricing[4][6].
– U.S. Demand: Driven by a $550 billion infrastructure bill (2021), requiring 12% fume dosage in bridge decks, pushing annual consumption to 180,000 MT by 2025[3][5].
Future Outlook and Market Dynamics
1. Capacity Expansions:
– Elkem’s China Expansion: New 100,000 MT/year plant in Yunnan targets electric vehicle battery composites[4][6].
– GCC Investments: UAE’s $23 billion rail network project will consume 45,000 MT fume annually starting in 2026[5].
2. Technological Innovations:
– Wet-Process Fume: Adds 15–20% compressive strength in 3D-printed concretes, opening a $120 million niche market by 2030[5][6].
– Carbon Capture: Trials show fume-enhanced concretes sequester 50 kg CO₂/MT via accelerated mineralization[1].
3. Sustainability Pressures:
– Circular Economy Mandates: EU’s CBAM policy penalizes imports with <75% fume recovery, threatening $80 million in Chinese exports[4][6].
The silica fume market remains tightly coupled to silicon metal production trends, with global output expected to be near 2 million MT/year by 2030. While China will continue leading volumes, premium-priced applications in decarbonized construction and advanced materials will drive innovation in Europe and North America. Stakeholders must prioritize filtration upgrades and carbon-neutral production methods to align with tightening global sustainability standards.
Sources
[1] https://market.us/report/silica-fume-market/
[2] https://microsilica-fume.com/silica-fume-market.html
[3] https://www.researchandmarkets.com/report/silica-fume
[4] http://ibracon.org.br/eventos/50cbc/plenarias/PER_FIDJESTOL.pdf
[5] https://exactitudeconsultancy.com/reports/19343/silica-fume-market
[6] https://www.industryarc.com/Report/15138/silica-fume-market.html
[7] https://www.marketsandmarkets.com/Market-Reports/silica-fume-market-173625350.html
[8] https://www.researchandmarkets.com/report/silica-fume
[9] https://www.cognitivemarketresearch.com/
Note: Content is made with the use of perplexity deep research.